Showing posts with label Price. Show all posts

Friday, 4 June 2021

How Recognise Key patterns of price action.


Key patterns of price action. Below I will describe several key patterns, but on the diagrams you can see the analysis from a technical point of view.

And also please pay attention to the rules, which I do not advise to ignore.

The Cup with a handle pattern is formed according to the following logic:

- On an upward movement, the bulls cannot push through the next resistance level , a correction begins. It is undesirable that there were impulses during a rollback, a moderate downward movement should be observed;
-By basic rules, the bottom of the cup should be formed in the area of correction levels. A deeper rollback is allowed in modified models. In case of a deep correction after entering the market, the position is transferred to breakeven as soon as possible, the probability of the trend continuation is lower, it is better to insure;

Double bottom

It all starts with the formation of a new low on a downtrend, after which a rollback against the trend occurs.

Then, the price goes down again and rests against the previous low. And finally, after pushing off from this level, an upward movement begins, which breaks through the level of the previous local maximum. It is after the breakout of this level (confirmation line) that the final formation of the 'Double Bottom' occurs and you can start buying.
The same is with a reversal in an upward market. After the first high, the price should fall by at least 10%. Otherwise, it will mean that the bears are not strong enough.

Saucer

Let's start with the shape of the figure. Contrary to its name, the correct shape of the 'Saucer' figure rather resembles a bowl.

As you can see, the figure is formed by a smooth price movement along a parabolic trajectory. The first half of the figure (the left side of the saucer) is a smooth descent from the edge of the saucer to its bottom. The second half of the figure (the right side of the saucer) is the same smooth rise from the bottom to the edge. Ideally, the second half should be a mirror image of the first. And the bottom should in no case be sharp .

The classic 'Saucer' is formed, as a rule, on large timeframes from D1. But you can also find him on H1.

Flat base

In trading, the term flat means an area on the chart, without a clearly defined direction of price movement, that is, a trend. In other words, flat is the opposite of a trend.

Misc Rules
-all BP = 10 pips
-ideal prior uptrend >30%
-for wks abv avg vol: #up>#down
-up 20% for new base
- undercut base resets base count
- 66% or 3rd stage base fails
- 80% of 4th stage base fails
- in base bottom look for
- shakeout
- tight closes
- volume dryout
- accumulation

Tuesday, 27 April 2021

Facebook Might Reveal their BitCoins Holdings Tomorrow


🇬🇧Guys we have that rumour in the market so we will hold our long positions, if this news is true we will have a great opportunity, so that's a great news!! Let's see what happens!! 


Long term/ middle 1 day or 2 days 


Good luck!!🤑🤞🏼


Facebook May Reveal Holding Bitcoin Tomorrow: Unconfirmed

https://u.today/facebook-may-reveal-holding-bitcoin-tomorrow-unconfirmed


Is Facebook holding Bitcoin secretly?

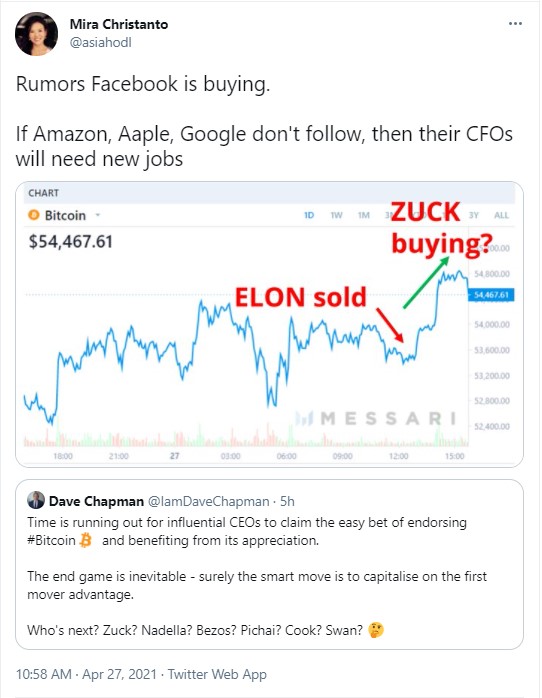
Among these influencers are Jason A. Williams, partner at Morgan Creek Digital, British entrepreneur and investor Alistair Milne, and Mira Christanto, senior research analyst at Messari.

The latter has assumed that the current rise of Bitcoin back above the $53,000 level may be due to Facebook buying Bitcoin, whereas the recent plunge below $48,000 was due to Tesla selling 10 percent of its BTC holdings.

Alistair Milne took to Twitter to say that, according to a rumor circulating around Crypto Twitter, Facebook has Bitcoin on its balance sheet. The rumor states that the company will reveal this fact after releasing its quarterly results when trading closes tomorrow: April 28.

If it happens, it would be taken as a major bullish signal by the community and is likely to trigger another Bitcoin rally.

It may have a similar effect on the market as when Elon Musk announced Tesla had bought $1.5 billion worth of Bitcoin earlier this year.

However, today it turned out that the e-car producer had sold 10 percent of its BTC stash to prove Bitcoin's liquidity. However, Musk confirmed that he has not sold any of his Bitcoin (surprise, surprise: he had never announced he held any, except for the 0.25 BTC he received as a gift in the past).

5277_1_098775
Image via Twitter

Related
Facebook to Release USD-Backed Stablecoin Diem for Trials This Year – Rebranded Libra

Facebook busy preparing to launch its Diem stablecoin

Facebook's holding Bitcoin would sound logical since the company is taking its second global attempt to enter the cryptocurrency space. The first was Libra stablecoin tied to a basket of leading fiat currencies and now with Diem, a USD-pegged currency.

As reported by U.Today previously, the Diem Association is now in the process of securing a payments license from regulators in Switzerland and plans to roll out Diem trials later this year.

Libra was unsuccessful since it faced strong resistance from lawmakers and central banks all over the world, who feared that the stablecoin from Facebook would disrupt financial and payments systems around the world.

China also became worried about that and tripled its efforts to test the digital yuan, DCEP.

Welcome to new Me !

✌  This has been a while since I have been in this game, chasing money.. When in reality, money should be chasing me instead, when and how ...